Toolkit for Identification and Quantification of Releases of Dioxins, Furans and Other Unintentional POPs PART III Annexes |
Annex 7 Per Capita / Per GDP Emissions
The Toolkit has been used by many countries to develop their national release inventories as required by Article 5 or Article 15 of the Convention. Through its structure for reporting, i.e., ten source groups and five release vectors, it is possible to gain some further insight into the global situation as to the sources of PCDD/PCDF releases. In 2011, 68 national inventories have been assessed and the quantitative releases have been correlated to geographic, demographic and source-specific information. The results for the total releases and according to release vector are shown in Table III.7.1; most countries have used the emission factors from the 2nd edition of the Toolkit (2005).
Table III.7.1 Summary table of PCDD/PCDF releases according to release vector (releases in g TEQ/a)
PCDD/PCDF Releases (g TEQ per year) Air Water Land Product Residue 26,400 1,200 6,000 4,800 19,800 45% 2% 11% 8% 34% Grand total (ca.) 58,500 68 countries used in this assessment are the following (ISO 3-digit code): ALB, ARG, ARM, AUS, AZE, BLR, BEN, BRN, BFA, BDI, KHM, CHL, CHN, HKG, COL, CIV, HRV, CUB, DJI, ECU, EST, ETH, FJI, GAB, GMB, GHA, GER, IND, IDN, IRN, JOR, KEN, LAO, LBN, LBR, LTU, MKD, MDG, MLI, MUS, MDA, MAR, NPL, NZL, NIC, NIG, NIU, PAN, PRY, PER, PHL, POR, ROU, SAM, SRB, SYC, SVN, LKA, SDN, SYR, TJK, TZA, THA, TGO, TUN, URY, VNM, ZMB (Fiedler et al. 2012).
The combined population is 3.80 billion, the reference years for the inventories ranged over ten years, from 1999 (Philippines) to 2009 (India). The following Table III.7.2 shows the releases on a per capita basis taking into account the estimated release for each vector and the combined five vectors (= total release) for the population of the respective year.
Table III.7.2 PCDD/PCDF releases per capita and year for each release vector and total (μg TEQ per person per year)
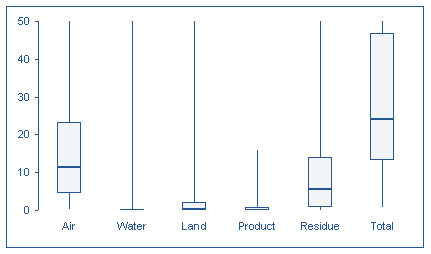
Air Water Land Product Residue Total Mean 21 4.6 3.4 1.1 10 40 Median 11 0.05 0.36 0.11 5.6 24 Minimum 0.20 0.0 0.0 0.0 0.0 0.88 Maximum 181 176 65 16 77 259 Count 68 68 68 68 68 68 The graphical sketch is shown in figure III.7.1.
Figure III.7.1 Graphical sketch for PCDD/PCDF releases per and per year (μg TEQ per person per year)
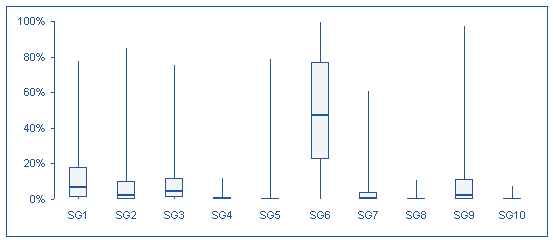
The weighting of the source groups ahows that most important source groups across 67 inventories are as follows:
- SG6 (open burning of biomass and waste) = 49%
- SG1 (incineration of waste) = 14%
- SG3 (conversion of energy) = 10%
- SG2 (production of metals) = 9%
Figure III.7.2 Statistical evaluation of importance of source groups
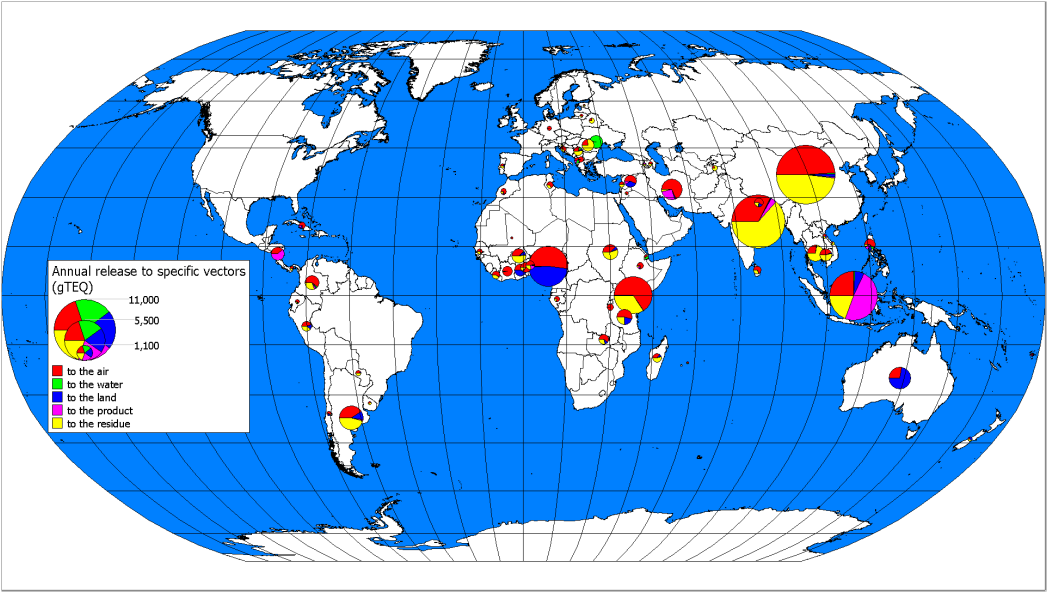
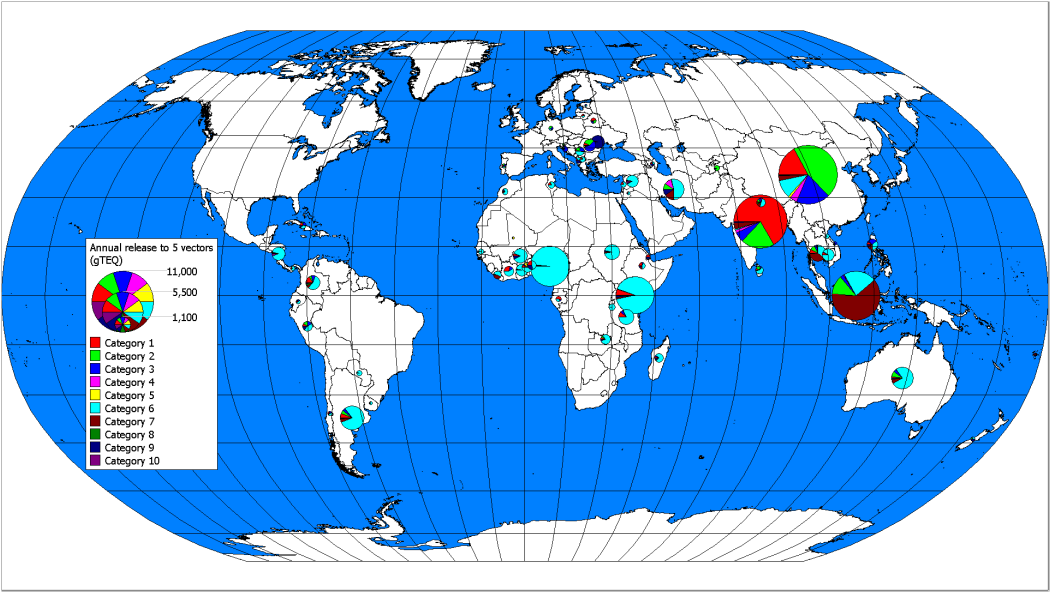
The following two figures present the total annual releases per country (Figure III.7.3) and the annual releases to air per country (Figure III.7.4). The contribution from each of the ten source groups to the total annual releases are shown in Figures III.7.5 and III.7.6.
Figure III.7.3 Total annual release per country (g TEQ/a)
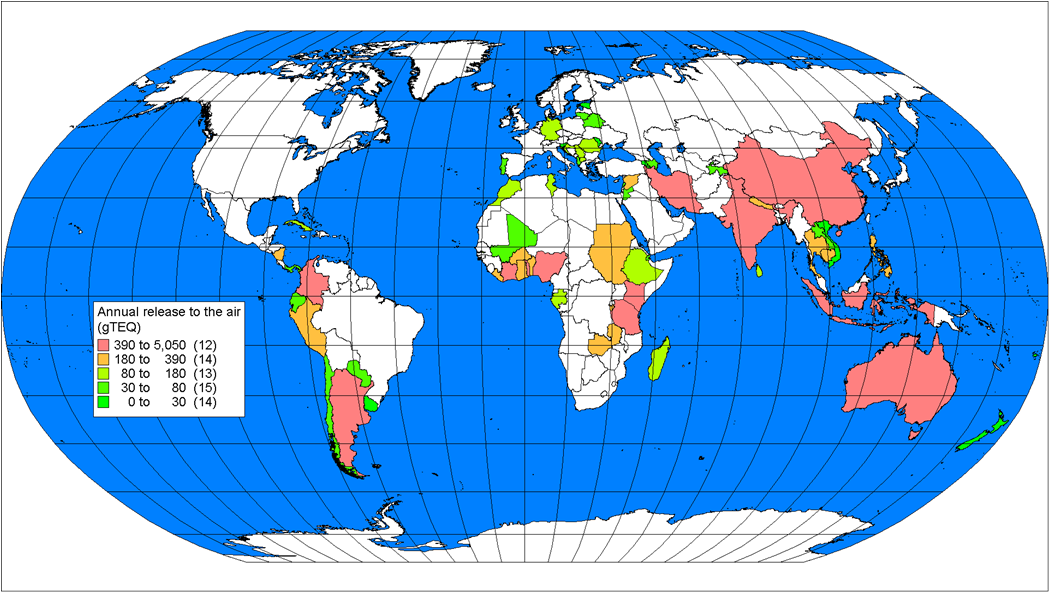
Figure III.7.4 Total annual release to air per country (g TEQ/a)
Figure III.7.5 Total annual release per country and vector (g TEQ/a)
Figure III.7.6 Total annual release per country and source group (g TEQ/a)
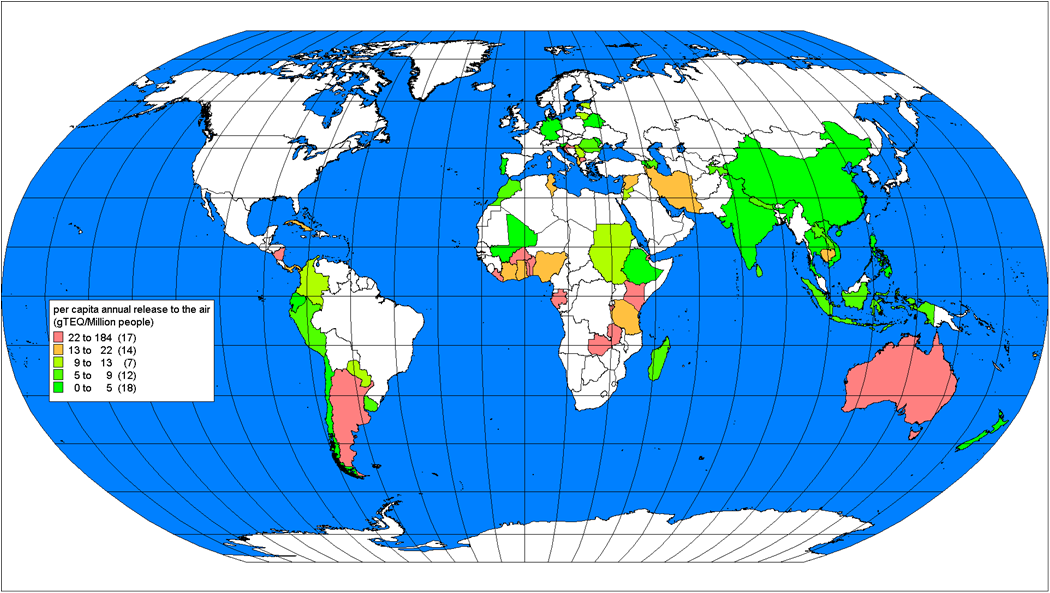
The annual releases on population basis for the total releases are shown in Figure III.7.7 and to air in Figure III.7.8.
Figure III.7.7 Per capita total annual release (μg TEQ/a)
Figure III.7.8 Per capita annual release to air (μg TEQ/a)
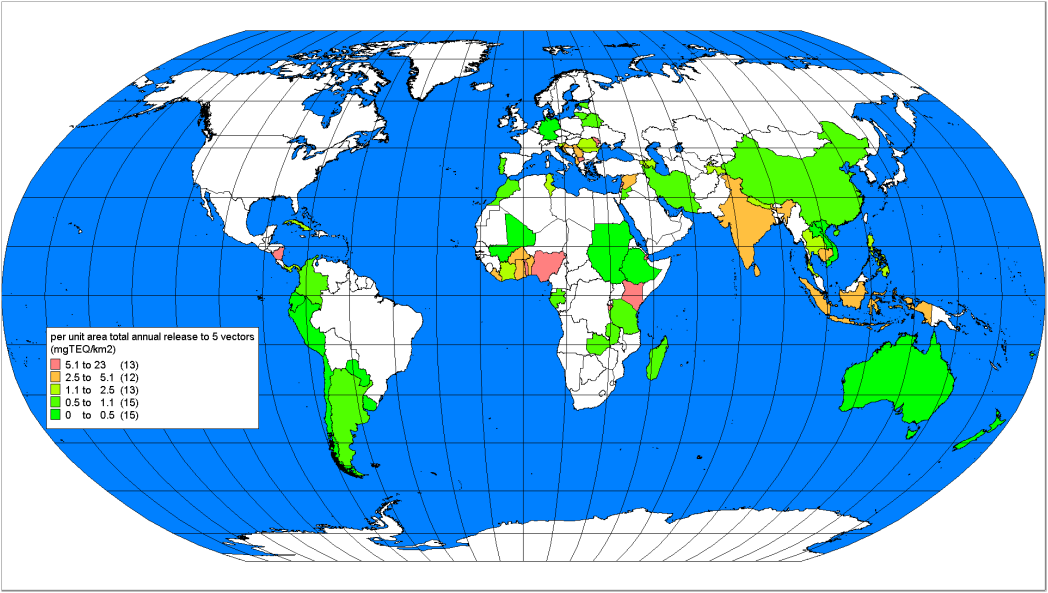
Finally, the releases per unit area (km2) is shown in Figure III.7.9 and based on per capita gross domestic product in Figure III.7.10.
Figure III.7.9 Total annual release per square kilometer (μg TEQ/km2)
Figure III.7.10 Total annual release according to per capita GDP (mg TEQ/USD person)